


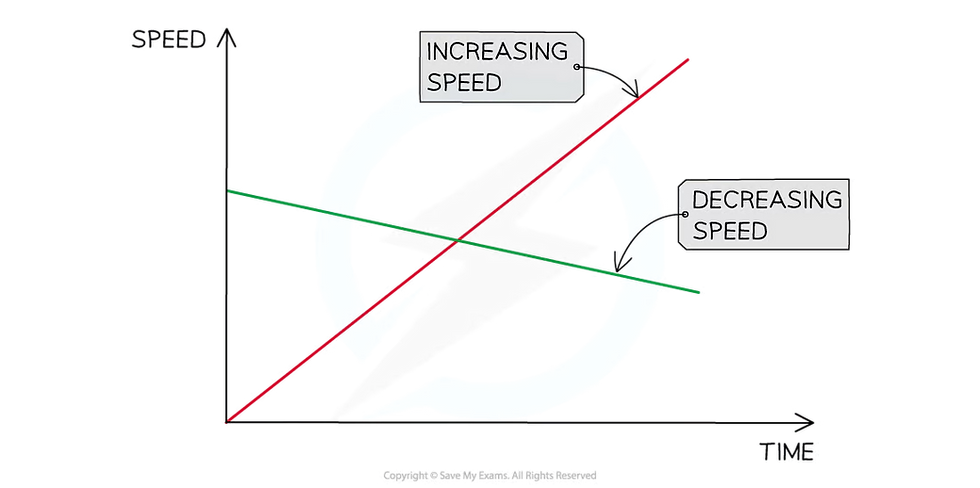
A speed-time graph shows how the speed of a moving object varies with time
The red line represents an object with increasing speed
The green line represents an object with decreasing speed
Acceleration on a Speed-Time Graph
Speed-time graphs also show the following information:
If the object is moving with a constant acceleration or deceleration
The magnitude of the acceleration or deceleration
A straight line represents constant acceleration
The slope of the line represents the magnitude of acceleration
A steep slope means large acceleration (or deceleration) - i.e. the object's speed changes very quickly
A gentle slope means small acceleration (or deceleration) - i.e. the object's speed changes very gradually
A flat line means the acceleration is zero - i.e. the object is moving with a constant speed

The distance travelled by an object can be found by determining the area beneath the graph
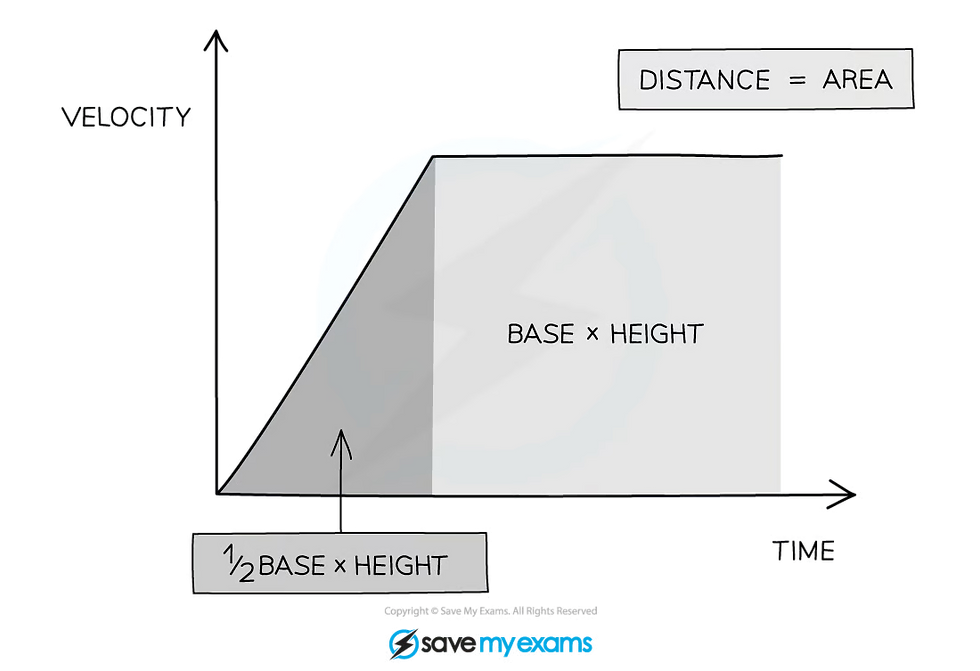
The distance travelled can be found from the area beneath the graph
![HOW TO ANALAYSE A PERSON, TO IF HE IS GOOD OR BAD. [MY EXPIRENCE]](https://static.wixstatic.com/media/338b83_3327cd5272eb4e17a1de3b1cab48e7a3~mv2.png/v1/fill/w_1024,h_578,fp_0.50_0.50,q_35,blur_30,enc_avif,quality_auto/338b83_3327cd5272eb4e17a1de3b1cab48e7a3~mv2.png)
![HOW TO ANALAYSE A PERSON, TO IF HE IS GOOD OR BAD. [MY EXPIRENCE]](https://static.wixstatic.com/media/338b83_3327cd5272eb4e17a1de3b1cab48e7a3~mv2.png/v1/fill/w_312,h_176,fp_0.50_0.50,q_95,enc_avif,quality_auto/338b83_3327cd5272eb4e17a1de3b1cab48e7a3~mv2.png)

